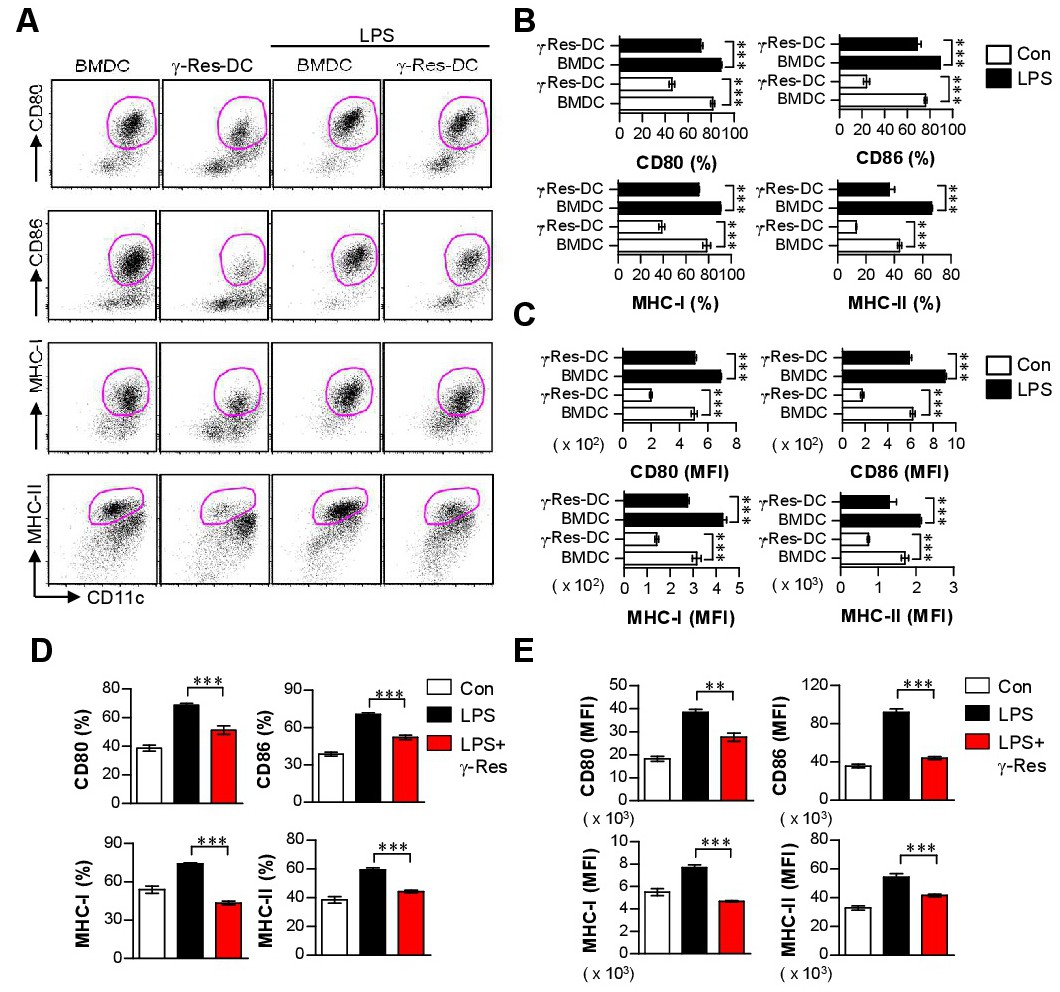
Fig. 5. Expression of co-stimulatory molecules and MHC class molecules in γ-Res-treated BMDCs and DCs generated by γ-Res in the presence of LPS. A-C) The BMDCs and γ-Res-DCs were treated with LPS (100 ng/mL). After incubation for 24 h, the cells were stained with anti-CD80, anti-CD86, anti-MHC-I, anti-MHC-II, and anti-CD11c Abs and analyzed by flow cytometry. The bar graphs show the means ± SD (n = 3 samples per group) of the percentage (B) or median fluorescence intensity (MFI) (C) of each surface molecule expressed by CD11c+ cells. D, E) The BMDCs were treated with LPS (100 ng/mL) or LPS with γ-Res (30 μg/mL) and analyzed for expression of surface markers CD80, CD86, MHC-I, MHC-II, and CD11c by flow cytometry. The bar graphs show the mean ± SD (n = 3 samples per group) of the percentage (D) or MFI (E) of each surface molecule expressed by CD11c+ cells. All results are representative of three independent experiments. All bar graphs show the means ± SD of three samples per group. **p<0.01, or ***p<0.001.